Big data technology is defined as software-utility. This technology is primarily designed to analyze, process and extract information from a large data set and a huge set of extremely complex structures. This is very difficult for traditional data processing software to deal with.
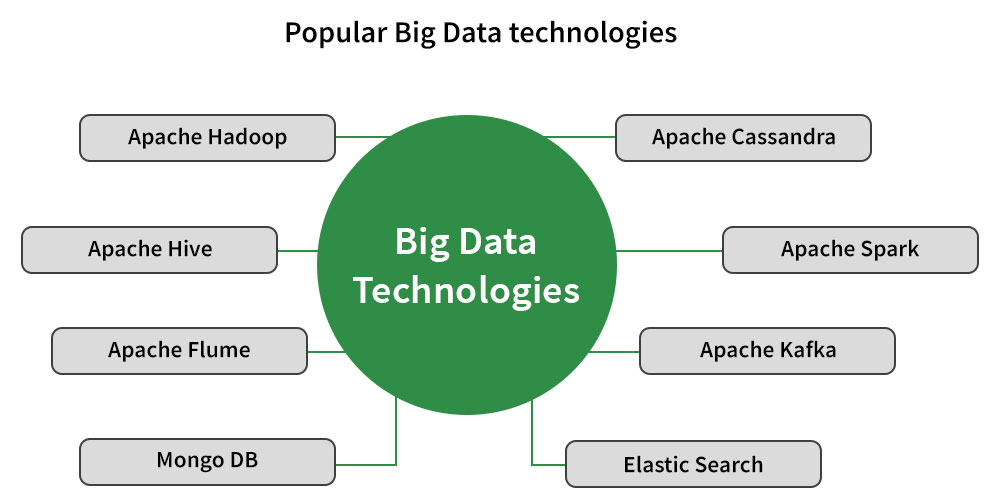
Big Data Technologies
Among the larger concepts of rage in technology, big data technologies are widely associated with many other technologies such as deep learning, machine learning, artificial intelligence (AI), and Internet of Things (IoT) that are massively augmented. In combination with these technologies, big data technologies are focused on analyzing and handling large amounts of real-time data and batch-related data.
Before big data technologies were introduced, the data was managed by general programming languages and basic structured query languages. However, these languages were not efficient enough to handle the data because there has been continuous growth in each organization's information and data and the domain
Top Big Data Technologies
- Data Storage
- Data Mining
- Data Analytics
- Data Visualization
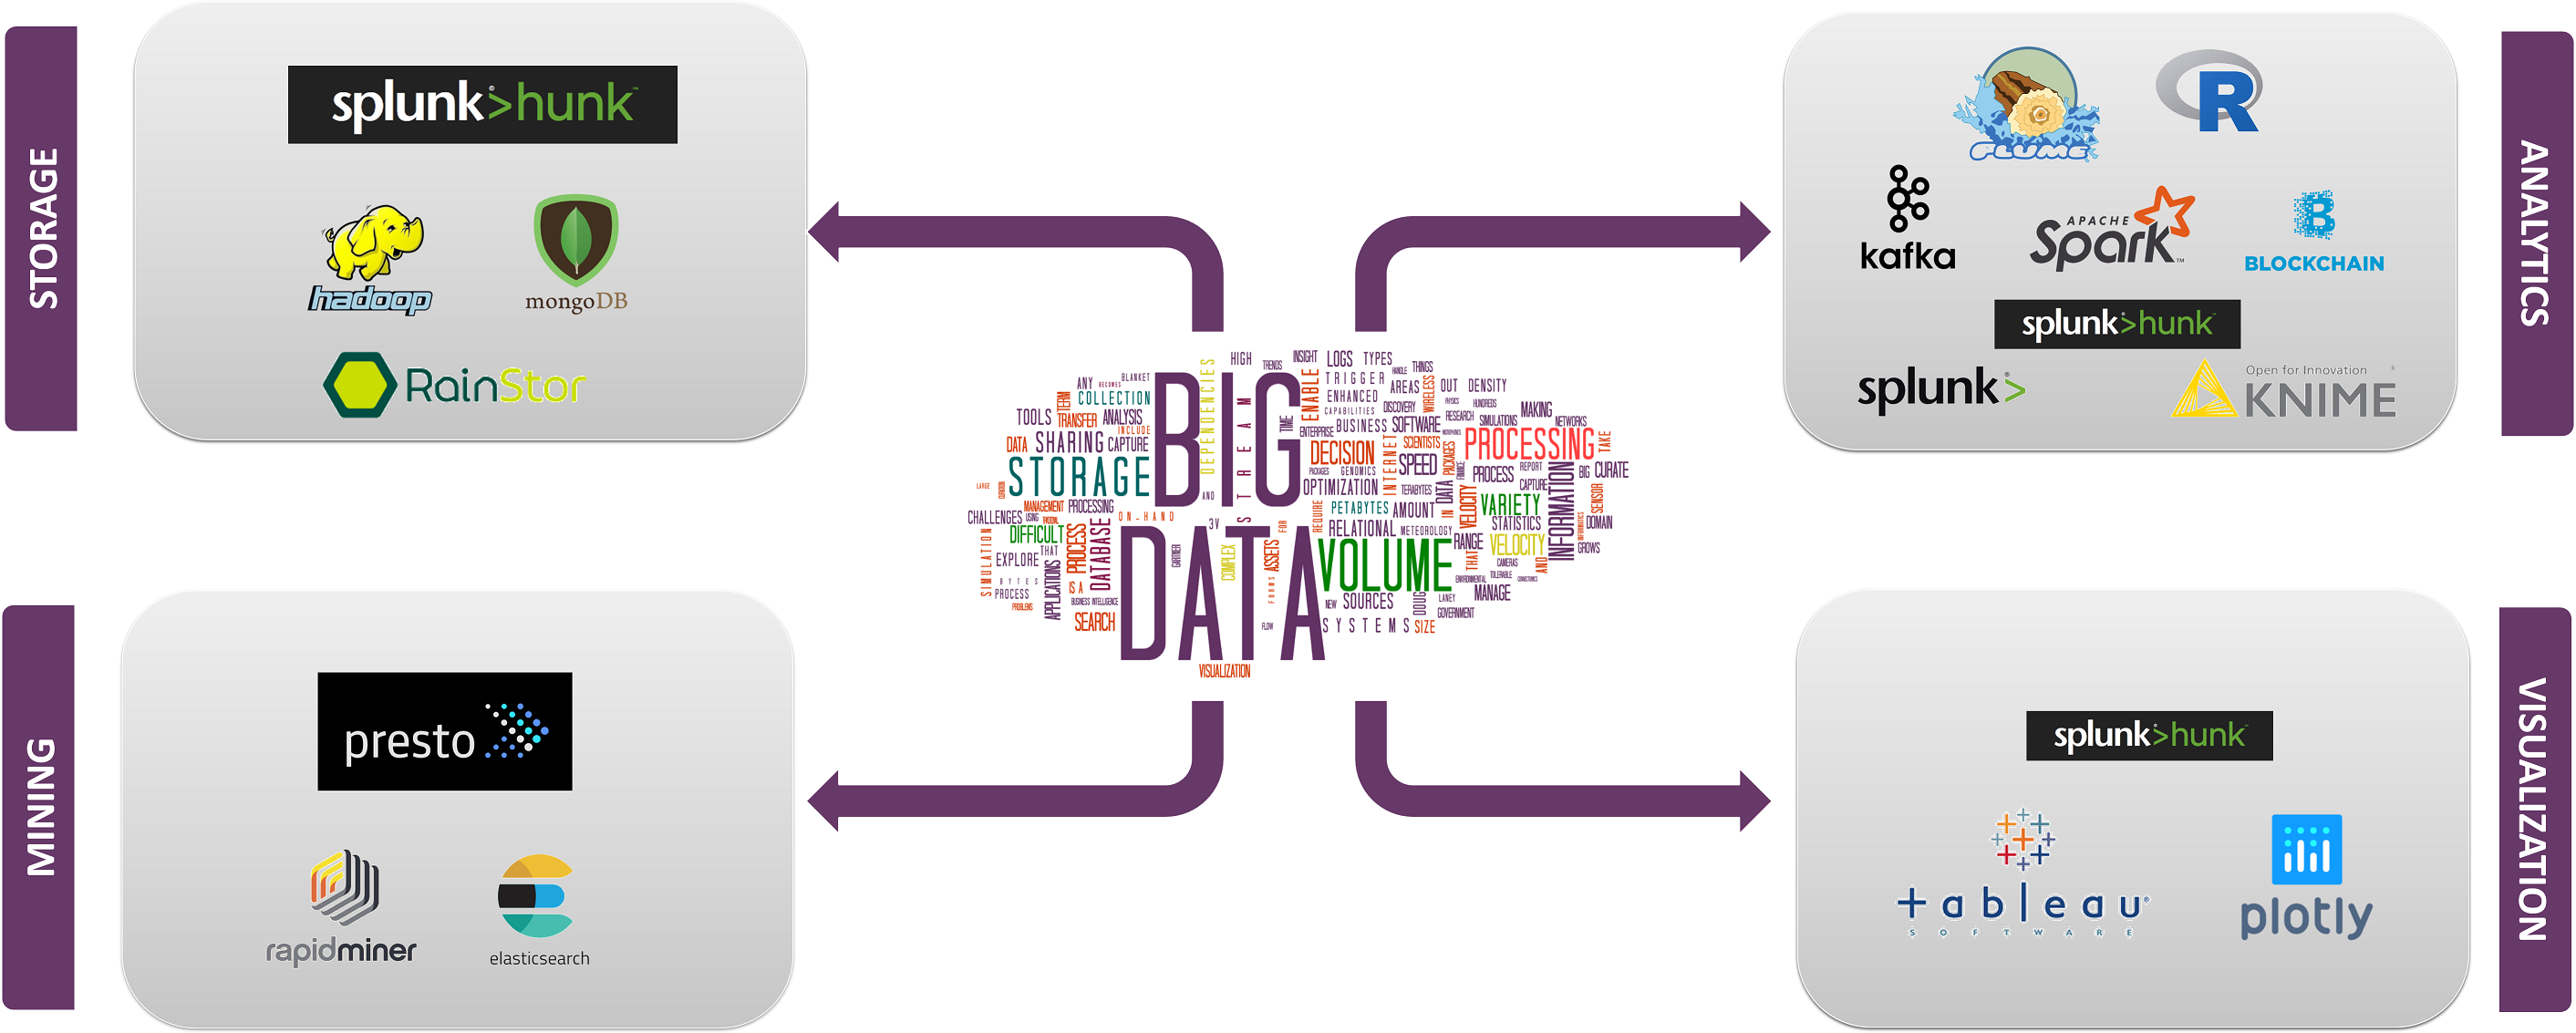
Big data technologies related to data storage are essential for managing the vast amounts of data generated daily. Here are some key technologies:


- Apache HBase: A distributed, scalable, big data store, which is a type of NoSQL database
- Snowflake: A cloud-based data warehousing solution that separates storage and compute functions, enabling efficient data storage and analytic
Data mining in big data technologies has a wide range of applications across various fields. Here are some notable uses:
Presto :
is an open source Distributed SQL Query Engine for running Interactive Analytic Queries against data sources of all sizes ranging from Gigabytes to Petabytes.
Companies Using Presto:

is a Centralized solution that features a very powerful and robust Graphical User Interface that enables users to Create, Deliver, and maintain Predictive Analytics
Companies Using RapidMiner:

- Healthcare: For predicting disease outbreaks, patient diagnosis, and treatment optimization
- Finance: To detect fraudulent transactions and analyze customer data for risk management
- Retail: For market basket analysis and personalized marketing strategies
- Manufacturing: To predict equipment failures and optimize supply chain management
- Telecommunications: For analyzing call data to improve customer service and network performance
- E-commerce: To enhance recommendation systems and customer experience
These applications leverage data mining to extract valuable insights from large datasets, driving innovation and efficiency in their respective fields.
Data Analytics in big data technology is pivotal for extracting meaningful insights from vast datasets. Here’s some key information:
Apache Kafka is a Distributed Streaming platform. A streaming platform has Three Key Capabilities that are as follows:
- Publisher
- Subscriber
- Consumer
Companies Using Kafka:

Companies Using KNIME:

- Definition: It involves systematic analysis of large and complex data sets, known as big data, to uncover trends, patterns, and correlations1.
- Techniques: Utilizes statistical analysis, predictive modeling, and machine learning to process diverse data types1.
- Outcome: Helps organizations make data-informed decisions, leveraging insights for strategic planning and operational efficiency1.
- Tools: Employs frameworks like Hadoop for distributed processing and advanced analytics tools for deeper data exploration1.
- Impact: Drives better decision-making, improves operational efficiency, and maintains competitive advantage by quickly adapting to market changes2.
Data Analytics is essential in today’s data-driven world, enabling businesses to harness the power of big data for actionable intelligence.
Data Visualization in big data technology is a crucial process that transforms complex data sets into visual representations, making it easier to understand and interpret. Here’s a concise overview:
TensorFlow :
has a Comprehensive, Flexible Ecosystem of tools, Libraries and Community resources that lets Researchers push the state-of-the-art in Machine Learning and Developers can easily build and deploy Machine Learning powered applications.
Companies Using TensorFlow:


- Purpose: It helps to quickly identify trends, patterns, and outliers in large volumes of data1.
- Techniques: Includes charts, graphs, heat maps, and more sophisticated visualizations like box plots and scatter plots2.
- Tools: Popular tools for big data visualization include Tableau, Qlik, and Power BI, which support interactive and real-time data exploration3.
- Impact: Effective visualization aids in decision-making and communicates complex data insights to all levels of an organization2.
Data Visualization is essential for making sense of the ‘big data’ and translating it into actionable insights.
How does big data work?
The central concept of big data is that the more visibility you have into anything, the more effectively you can gain insights to make better decisions, uncover growth opportunities, and improve your business model.
Making big data work requires three main actions:
- Integration:
Big data collects terabytes, and sometimes even petabytes, of raw data from many sources that must be received, processed, and transformed into the format that business users and analysts need to start analyzing it.
- Management: Big data needs big storage, whether in the cloud, on-premises, or both. Data must also be stored in whatever form required. It also needs to be processed and made available in real time. Increasingly, companies are turning to cloud solutions to take advantage of the unlimited compute and scalability.
- Analysis: The final step is analyzing and acting on big data—otherwise, the investment won’t be worth it. Beyond exploring the data itself, it’s also critical to communicate and share insights across the business in a way that everyone can understand. This includes using tools to create data visualizations like charts, graphs, and dashboards.
Comments
Post a Comment